Researcher: Marc Henry (University Professor, Doctor of Science)
Marc Henry is a qualified research leader, chemist, and physicist, and the author of more than one hundred scientific articles. He has practiced and taught quantum physics for more than thirty years.
Expertise commissioned by NV Dynamized Technologies on 29.08.2019


Method: The electrophotonic images from the Coramp laboratory in Brens France were analyzed and interpreted by the expert opinion of Professor Marc Henry after mathematical and statistical processing (via algorithms) to improve their contrasts.
After eliminating the image's "background noise", saturations, artifacts, etc., the reprocessing focuses on the average photon light intensities, their fair or unfair distribution, the diversity and richness of information, etc. This is to retain only the most statistically representative images (95% reliability!) and to move on to more in-depth and global comparative interpretations between dynamized and non-dynamized water in terms of "quantity" of energy and "quality of information", i.e., the photodiversity index (which, by analogy with ecology, we can call biodiversity).
This index is the interpretation of the water footprint (photon profile). It is calculated as a function of several parameters that qualitatively evaluate the captured photons, including the contrast between pixels (the more contrast, the more focused the energy!), their diversity (i.e., the richness of the image, which is determined by the difference in average intensity between pixels), the amount of information contained in the image, the fair distribution of light, the coherence of the emitted frequencies, their amplitude, etc. In this regard, we can imagine that the higher this index, the more it indicates compatibility with living organisms in general.
Electrophotonic analysis expertise reveals significantly greater photodiversity in dynamized water
Dynamic water image no. 8 in TIFF format (the most statistically significant image with 95% confidence) with the application of various filters to enhance contrast and allow interpretation in terms of photodiversity:
Spreading of the crown (variation in the crown/streamer ratio, sign of lower surface tension confirmed by the SGS Rotterdam laboratory, 15% decrease in water surface tension after dynamization)
Emission of a greater amount of light energy (more photons considering the photons of the global image taking into account the image noise), more focused (clearly more contrasts and concentration of energy and therefore of coherence of photons), streamers in the dynamized droplets are longer (further irradiance> < the crown) confirmed by a significant average ∆ of + 22% of the Hot Spot Pixel , which indicates that the energy is retained longer in the dynamized water, a greater amount, richness and diversity of information (entropy), greater statistical reproducibility (more stability); Couple these findings with the bioelectronic analysis which confirms that dynamized water has more electrons available and retains more energy
Undynamized water image n°7 in TIFF format (the most statistically significant image with 95% confidence):
spherical shape of the crown around the droplet on the electrode (sign of a higher surface tension, see the analysis of the SGS laboratory, Rotterdam, which confirms this)
Lower light emission
Dynamic water (image n° 8 statistically representative with 95% confidence: grayscale, computer color fire & 16 colors)
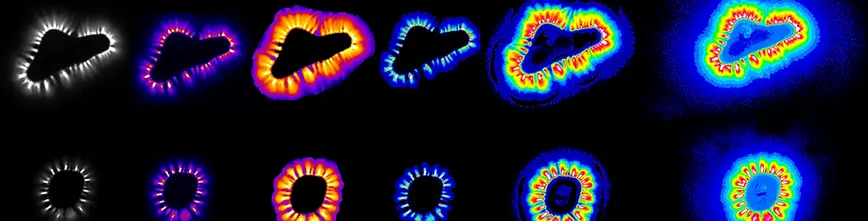
Undynamized water (recording no. 7 statistically representative with 95% confidence: grayscale, computer colors fire & 16 colors)
Additional statistical analysis performed by Dr. M. van Wassenhoven in March 2025 based on the postmortem protocol of Prof. M. Henry and on electrophotonic images from the Coramp laboratory taken in 2019 and expertized by Prof. M. Henry.
Additional statistical analysis of the electrophotonic images (Dr. M. van Wassenhoven in March 2025 according to the postmortem protocol of Prof. M. Henry): 100% statistical reliability of the measurements allowing to draw reliable scientific conclusions on the differences between dynamized water and non-dynamized water due to the average variability coefficients of the 30 parameters analyzed (structure of the images, their light intensity and the number of pixels) on the 12 images of droplets in each series (non-dynamized >< dynamized) is extremely low < 1.3%, which allows systematic reproducibility of the measurements and therefore scientific validation of the conclusions!
The amount of radiated energy is increased by +8% for dynamized water (Lumen/m² x Pixel/cm²) => this contributes to cell metabolism.
The intensity of the emitted light (lumen/m²) is 5% greater for dynamized water.
The surface tension of the dynamized water is reduced , the drop of dynamized water spreads wider: + 5% in surface area and + 6% in circumference => this ensures better cellular hydration.
Dynamized water is more structured and organized (entropy increased by +20% ).
The FFT (Fast Fourier Transform) images indicate the following:
That there are more available electrons in dynamized water => this helps to counteract free radicals and cellular aging .
That the organization of information in this is also much more structured .
That there is also a larger surface area of the light halo, which indicates a larger frequency amplitude of the visible light spectrum => this indicates a greater radiation of light energy pulsating at lower frequencies .

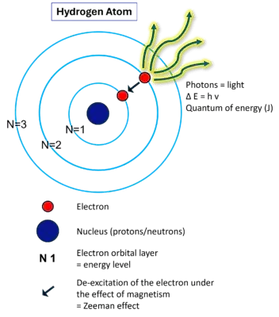
Attempt to explain the increase in luminous flux observed in dynamized water using quantum mechanics (Planck, Bohr, Einstein):
The magnetic field that the Biodynamizer radiates onto the water molecules (which are dipoles) should influence:
1. The electrons , which vibrate at certain frequencies and are deactivated by magnetism. They then move to a lower orbital electron layer (closer to the nucleus) and release photonic energy = quantum energy (proportional to the energy difference between these two levels = the Zeeman effect).
2. the spin of the electron (i.e. the rotation of the electron about its axis, Uhlenbeck/Goudsmit)